Brixmor Property Group (BRX)·Q4 2025 Earnings Summary
Brixmor Delivers Record Occupancy as FFO Jumps 9% to $0.58
February 10, 2026 · by Fintool AI Agent
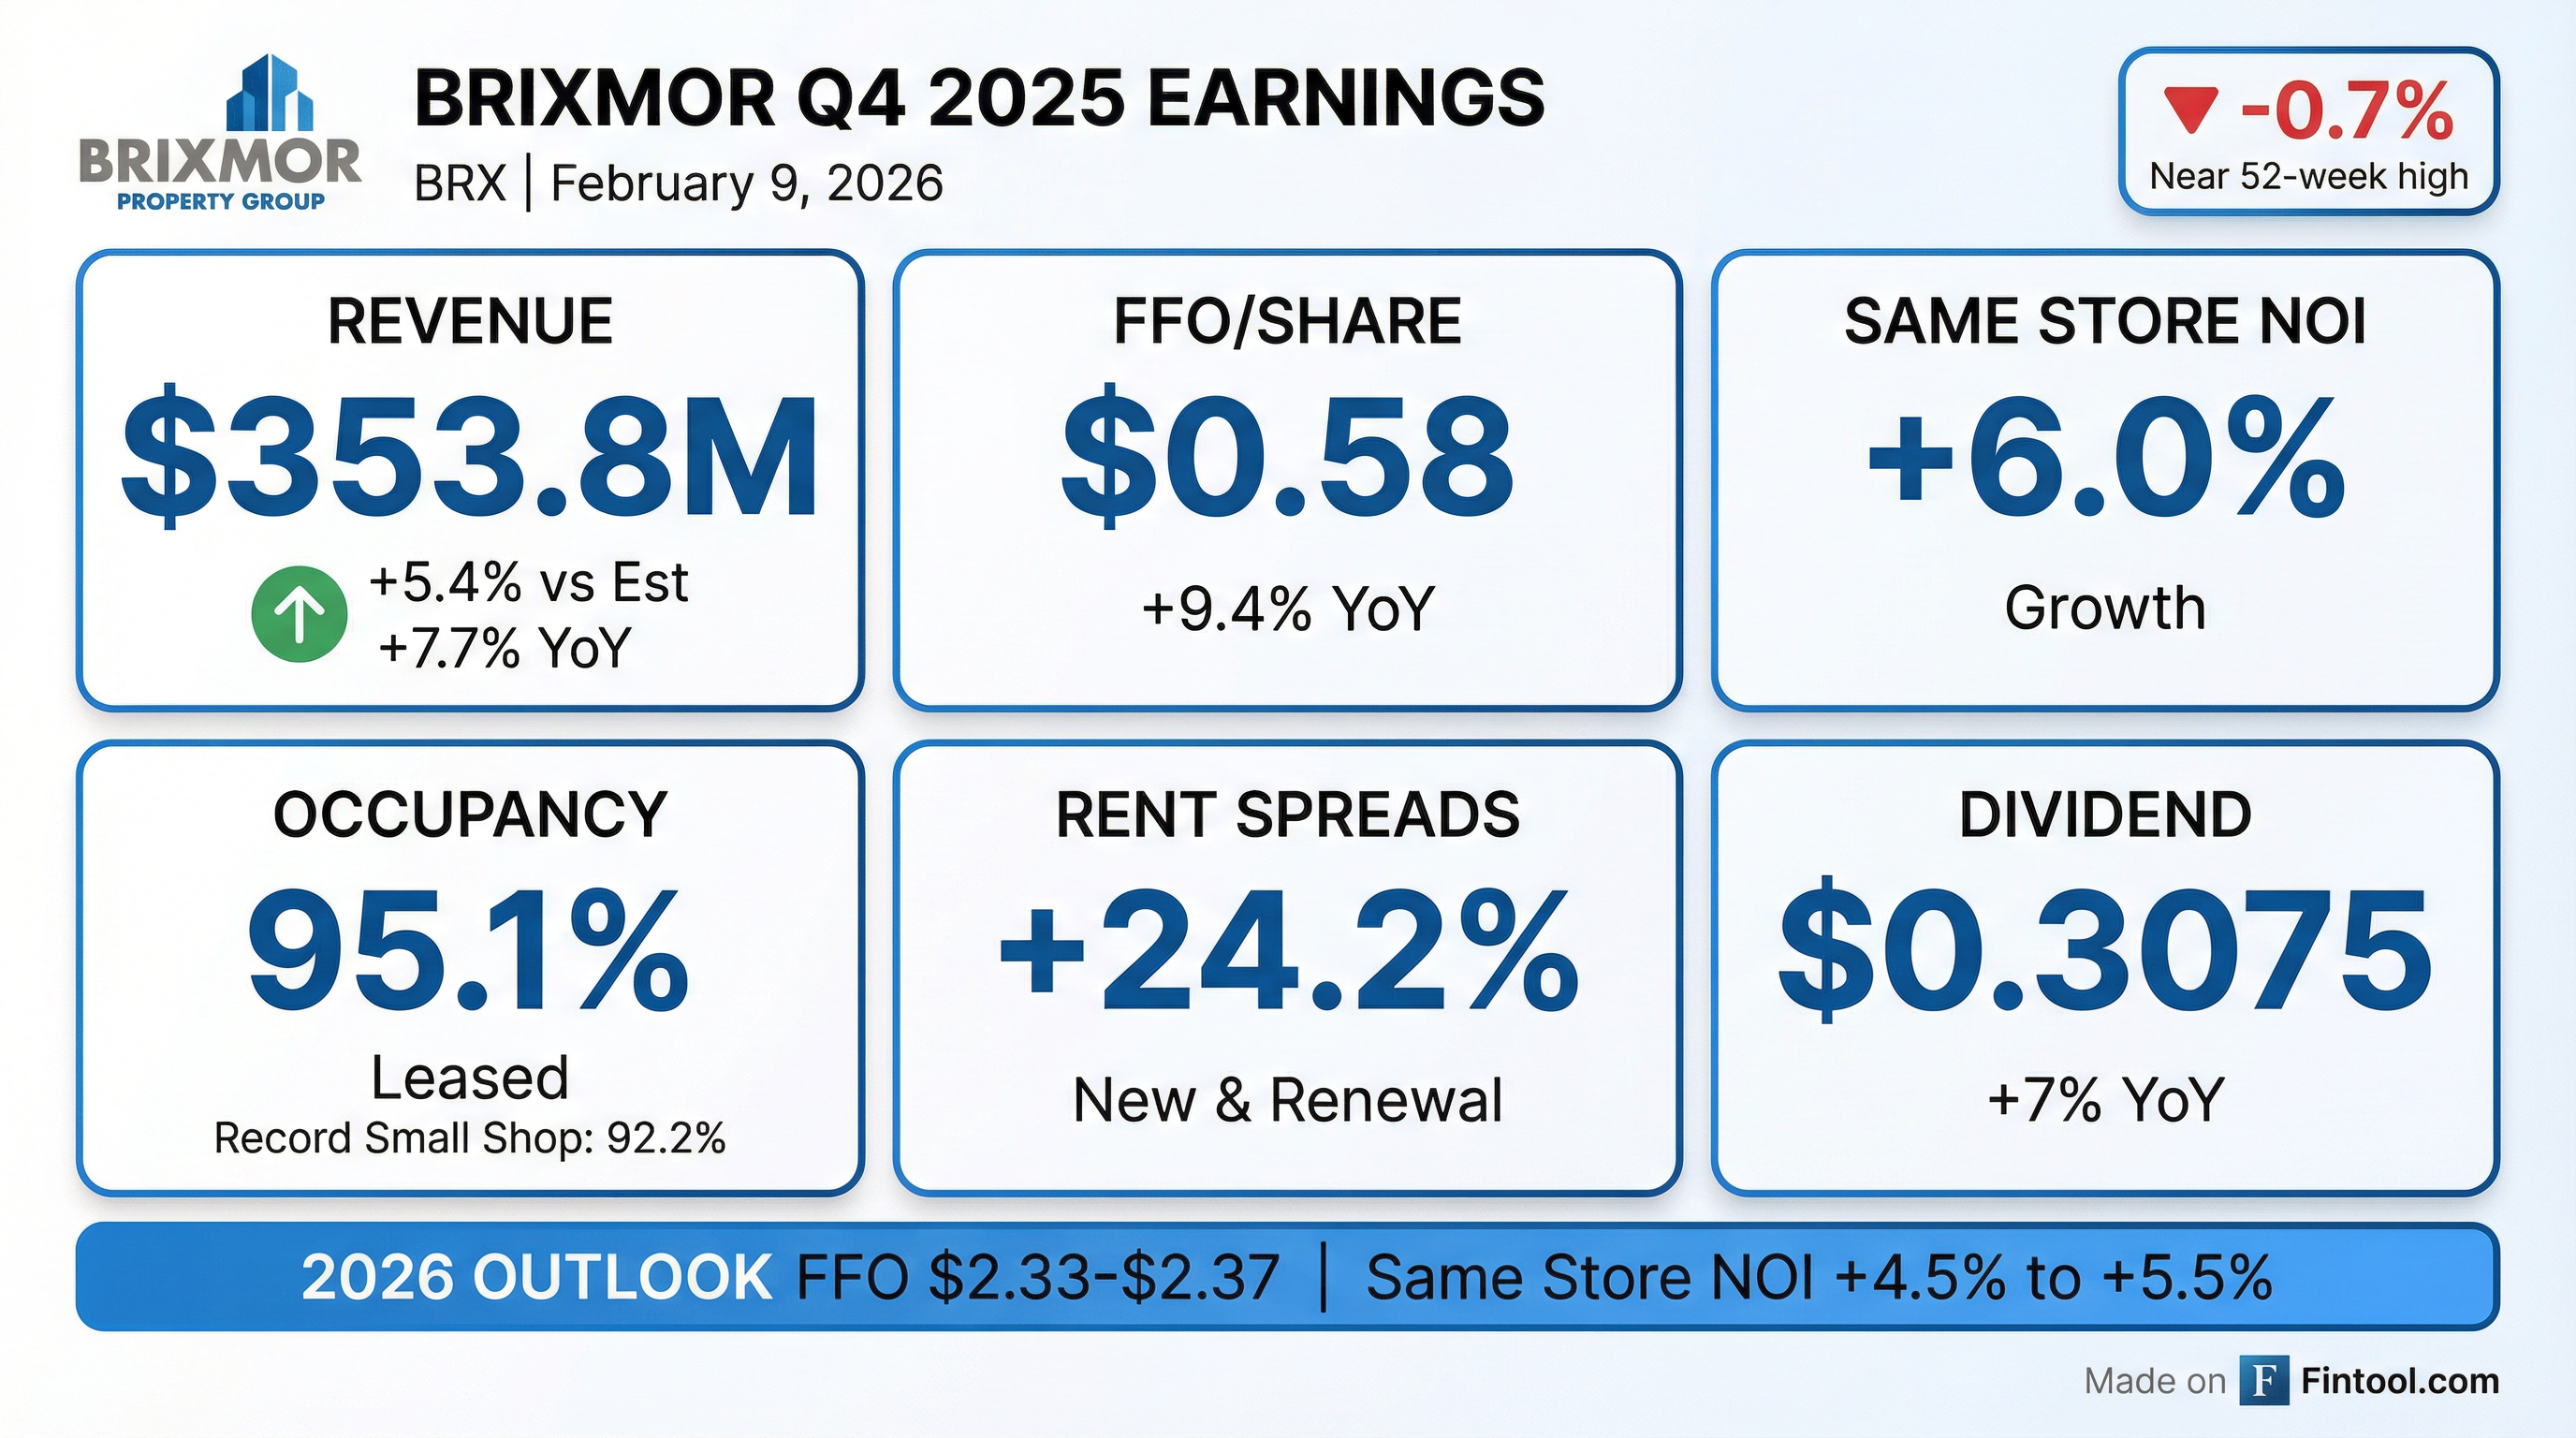
Brixmor Property Group (NYSE: BRX) reported Q4 2025 results that exceeded expectations, with revenue beating consensus by 5.4% and FFO per share growing 9.4% year-over-year to $0.58. The open-air, grocery-anchored shopping center REIT achieved record small shop occupancy of 92.2% and delivered its strongest sequential occupancy gain in company history—100 basis points to 95.1% total occupancy.
On his first earnings call as permanent CEO, Brian Finnegan (21-year Brixmor veteran) emphasized continuity and acceleration: "I am thrilled to join you today for my first call as permanent CEO of Brixmor... I am grateful to step into this role at a moment of real strength for the company." Management guided to 2026 FFO of $2.33-$2.37 and same property NOI growth of 4.5%-5.5%.
Did Brixmor Beat Earnings?
Revenue beat by 5.4%. Brixmor reported total revenues of $353.8 million versus consensus estimates of approximately $335.6 million. This represents 7.7% growth from $328.4 million in Q4 2024.
FFO grew 9.4% YoY. Nareit FFO came in at $178.4 million, or $0.58 per diluted share, compared to $161.4 million, or $0.53 per diluted share, in Q4 2024. For the full year, FFO reached $693.3 million or $2.25 per share versus $647.9 million or $2.13 per share in 2024.
Net income jumped 64%. GAAP net income attributable to Brixmor was $137.1 million, or $0.44 per diluted share, compared to $83.4 million, or $0.27 per diluted share, in Q4 2024.
What Drove the Strong Performance?
The quarter's outperformance was driven by accelerating same property NOI growth and record occupancy levels.
Same property NOI grew 6.0% in Q4 2025, the strongest quarterly result of the year, compared to 4.0% in Q3, 3.8% in Q2, and 2.8% in Q1. Base rent contributed 360 basis points to the growth.
Occupancy hit record levels:
- Total leased occupancy: 95.1% (up from 94.1% in Q3)
- Anchor occupancy: 96.6%
- Small shop occupancy: 92.2% — a company record
The leased-to-billed occupancy spread of 350 basis points signals more rent commencements ahead.
Rent spreads remained robust:
- New lease rent growth: +39% for the year
- Renewal rent growth: +15% — third consecutive year of mid-teens renewal growth
- Full year new lease ABR: $70 million — a company record
- Net effective rents: $23.66 — record levels
- Payback period: 2 years — most attractive since 2016
Tenant mix improving: The 3+ million sq ft of new leases included 8 new grocer leases with Publix, Sprouts, and Big Y, plus multiple deals with leading off-price retailers. Small shop tenancy quality jumped with 70% of small shop rent now from multi-unit operators.
Signed but not commenced leases represent significant embedded growth: $62 million of ABR at $23/sq ft average, with approximately $43 million expected to commence in 2026. The spread between leased and built occupancy ended at 350 basis points.
What Did Management Guide?
New CEO Brian Finnegan provided 2026 guidance that implies continued growth momentum:
FFO bridge from 2025 to 2026:
- Same property NOI growth: +$0.14 to +$0.17
- Interest expense: -$0.03
- Lease termination fees: -$0.03
- Non-cash GAAP adjustments: -$0.02 to -$0.01
- Transaction activity: +$0.01
- G&A and other: +$0.01
Uncollectible revenues are expected to be 75-100 basis points of total revenues in 2026.
CFO Steve Gallagher noted: "The tailwinds created by the stacking of 2025 rent commencements, contributions from redevelopment, embedded rent bumps, and combined with the signed-but-not-yet commenced pipeline provide strong visibility into our 2026 outlook."
What Did the Q&A Reveal?
On bad debt improvement: Analysts questioned whether the tighter bad debt guidance (75-100 bps vs. prior 75-110 bps) reflects structural improvement. CEO Finnegan highlighted low drugstore and theater exposure, with 70% of small shop rent from multi-unit operators. CFO Gallagher added: "There's not a lot of disruption in the future that we're seeing."
On acquisition cap rates: CIO Mark Horgan noted cap rate compression across open-air retail, with "smaller grocery anchor deals and unanchored strip" trading in the low-to-mid 5s in hot markets like the Southeast and California. Brixmor is targeting larger, more complex deals with less competition—selling at ~7% caps and buying at 9-10% IRRs.
On the SNO pipeline: With $62 million of signed-but-not-commenced rent, analysts asked about replenishment. Finnegan: "We're still 50 basis points below the prior peak from a leased occupancy perspective. And that was by no means a cap on the portfolio because the portfolio is in a much better position today."
On the large Q4 term fee: The outsized lease termination income came from a Bay Area center where Brixmor controlled the entire site after recapturing Kohl's and Party City space. "We could do a retail plan today as we have LOIs for all that space. Or alternatively, there may be an opportunity for us to get the land rezoned for residential."
On CapEx sustainability: The 14% YoY decline in CapEx reflects both competition for space (retailers more willing to accept existing conditions) and improved portfolio quality. Finnegan: "The deferred maintenance overhang of this portfolio is behind us... This is now 3 years running of maintenance CapEx lowest for the portfolio."
How Is Brixmor Using AI?
CEO Finnegan emphasized technology as a strategic priority, with early AI wins in:
- Lease abstraction and summarization — automating document review
- Tenant health analytics — detecting early warning signals like payment date drift
- Leasing prospecting tools — helping junior team members identify opportunities
- Legal efficiency — reducing outside counsel spend on leasing matters
"We've challenged leaders across the organization to really look at their business, look at ways to improve that through technology."
How Did the Stock React?
BRX shares traded down 0.7% on the earnings release date, closing at $28.13. The muted reaction reflects the stock trading near its 52-week high of $28.61 heading into results.
Key context:
- 52-week range: $22.29 - $28.61*
- Current price vs 50-day average: +7.7%*
- Current price vs 200-day average: +6.8%*
*Values retrieved from S&P Global
The stock has rallied approximately 26% from its 52-week low, reflecting improving sentiment toward open-air retail REITs amid strong tenant demand.
What Changed From Last Quarter?
Occupancy acceleration. The sequential occupancy gain in Q4 (from 94.1% to 95.1%) was described as the "largest sequential occupancy gain in Company's history." Retention rate improved to 87%, up 180 bps from last year.
Same property NOI inflected higher. Q4's 6.0% growth was a meaningful acceleration from the 4.0% posted in Q3, supported by 360 bps contribution from base rent growth and 200 bps from ancillary/other income.
Capital recycling picked up. Q4 saw $190.7 million of acquisitions and $170.2 million of dispositions, including Brixmor's last asset in Alabama. 2025 was the most active acquisition year in company history at ~$420 million.
CEO transition completed. Brian Finnegan officially became CEO on January 1, 2026, replacing retiring CEO Jim Taylor. Also promoted: Stacy Slater to EVP, Capital Markets, and Matt Ryan to expanded role as South Region President including National Property Operations.
Expense recovery hit record. Recovery ratio reached 92.3% at year-end as CAM clause cleanup efforts paid off.
What's the Investment Pipeline?
Brixmor maintains an active reinvestment pipeline that supports future growth:
In-process reinvestment projects: $336.4 million at an expected average incremental NOI yield of 10%
- 14 anchor space repositioning projects: $63.9M at 7-14% yield
- 6 outparcel development projects: $16.8M at 12% yield
- 13 redevelopment projects: $255.8M at 10% yield
Q4 stabilizations: $92.0 million of projects stabilized at 9% average incremental NOI yield.
Notable Q4 acquisitions:
- Chino Spectrum Towne Center (Chino Hills, CA): $138.0 million for 461,246 sq ft grocery-anchored regional center
- Broomfield Town Centre (Denver suburb): $51.2 million for 175,368 sq ft grocery-anchored community center
Recent development highlights:
- Davis Collection (UC Davis): Tore down obsolete anchor and delivered Nordstrom Rack, Ulta, J.Crew Factory, Mendocino Farms, and Urban Plates
- Rockland Plaza (New York Metro): New redevelopment added to pipeline with Nordstrom Rack, Ross, Burlington, and new outparcel buildings
- Large-format Target: Opening in Dallas in the coming weeks
How Is the Balance Sheet?
Brixmor maintains a conservative balance sheet with ample liquidity:
Credit ratings: BBB/Stable from Fitch, S&P, and Moody's (Baa2).
Debt structure: 100% of debt is effectively fixed rate. Weighted average maturity is 4.5 years.
2025 capital markets activity:
- September 2025: Issued $360 million of 4.85% Senior Notes, pre-funding the June 2026 $600 million 4.125% maturity
- Renewed $400 million share repurchase program
- Renewed $400 million ATM equity program
- Amended $1.75 billion unsecured credit facilities, extending maturities and lowering pricing
CFO Gallagher on balance sheet: "Debt to EBITDA is 5.4 times, leaving our balance sheet well-positioned to support our business plan." Brixmor has delivered FFO growth of 4%+ since 2022 with a 4.4% dividend yield and dividend growing at a 6% CAGR.
What About the Dividend?
The Board declared a quarterly dividend of $0.3075 per share ($1.23 annualized), payable April 15, 2026 to shareholders of record April 2, 2026.
This represents a 7% increase from the $0.2875 quarterly dividend in Q4 2024.
Payout ratio: 52.8% of FFO in Q4 2025, down from 54.4% in Q4 2024, indicating room for continued dividend growth.
Key Takeaways
-
Beat and raise. Revenue topped estimates by 5.4%, FFO grew 9.4% YoY, and 2026 guidance implies continued acceleration with 4.5-5.5% same property NOI growth.
-
Record occupancy. Small shop occupancy hit an all-time high of 92.2%, with the largest sequential occupancy gain (100 bps) in company history to 95.1% total.
-
Pricing power intact. New lease rent growth of 39% and renewal growth of 15% for the third consecutive year of mid-teens renewals. Net effective rents hit record $23.66.
-
Embedded growth. The 350 bps leased-to-billed spread and $62 million of SNO ABR (with ~$43M commencing in 2026) provide strong visibility.
-
New leadership continuity. CEO Finnegan's first call emphasized no strategy changes—just acceleration. Technology/AI initiatives already yielding results in lease abstraction, tenant health, and prospecting.
-
Tenant quality improving. 70% of small shop rent now from multi-unit operators. 8 new grocer leases signed. Low exposure to drugstores and theaters.
-
CapEx efficiency. Deal costs down 14% YoY as retailers compete for space and accept existing conditions. Payback period now 2 years—best since 2016.
Data sourced from Brixmor's Q4 2025 8-K filing, earnings press release, and Q4 2025 earnings call transcript dated February 10, 2026. Stock data from S&P Global.